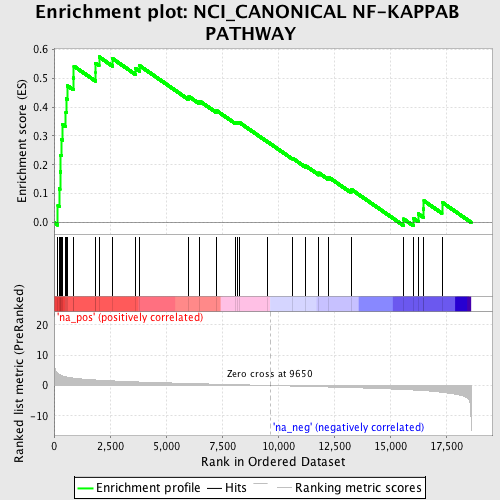
Profile of the Running ES Score & Positions of GeneSet Members on the Rank Ordered List
| Dataset | set04_transDMproB_versus_LMproB |
| Phenotype | NoPhenotypeAvailable |
| Upregulated in class | na_pos |
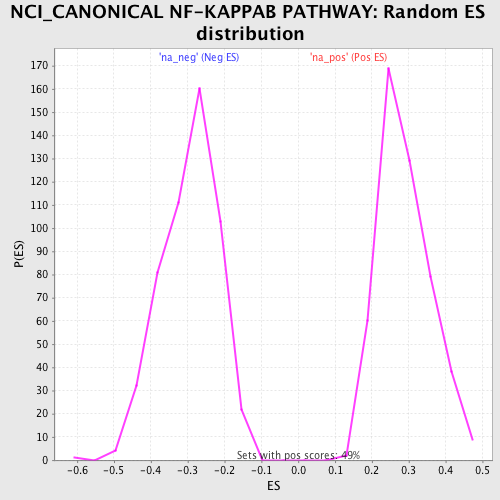
| GeneSet | NCI_CANONICAL NF-KAPPAB PATHWAY |
| Enrichment Score (ES) | 0.5740814 |
| Normalized Enrichment Score (NES) | 1.9923087 |
| Nominal p-value | 0.0 |
| FDR q-value | 0.029159764 |
| FWER p-Value | 0.15 |
| PROBE | GENE SYMBOL | GENE_TITLE | RANK IN GENE LIST | RANK METRIC SCORE | RUNNING ES | CORE ENRICHMENT | |
|---|---|---|---|---|---|---|---|
| 1 | RELB | 170 | 3.848 | 0.0578 | Yes | ||
| 2 | BCL10 | 229 | 3.599 | 0.1172 | Yes | ||
| 3 | RIPK2 | 264 | 3.470 | 0.1757 | Yes | ||
| 4 | CYLD | 296 | 3.352 | 0.2323 | Yes | ||
| 5 | UBE2D3 | 331 | 3.271 | 0.2874 | Yes | ||
| 6 | BCL3 | 384 | 3.121 | 0.3389 | Yes | ||
| 7 | TRAF6 | 525 | 2.859 | 0.3810 | Yes | ||
| 8 | IKBKG | 544 | 2.823 | 0.4292 | Yes | ||
| 9 | PIK3R1 | 600 | 2.724 | 0.4736 | Yes | ||
| 10 | NFKB2 | 868 | 2.407 | 0.5010 | Yes | ||
| 11 | NFKBIA | 885 | 2.388 | 0.5417 | Yes | ||
| 12 | MAPK14 | 1847 | 1.802 | 0.5213 | Yes | ||
| 13 | FBXW11 | 1852 | 1.799 | 0.5524 | Yes | ||
| 14 | TNFRSF1A | 2006 | 1.721 | 0.5741 | Yes | ||
| 15 | TNFAIP3 | 2612 | 1.512 | 0.5678 | No | ||
| 16 | ATM | 3638 | 1.186 | 0.5333 | No | ||
| 17 | NOD2 | 3813 | 1.137 | 0.5437 | No | ||
| 18 | MALT1 | 6017 | 0.662 | 0.4366 | No | ||
| 19 | ERC1 | 6494 | 0.575 | 0.4210 | No | ||
| 20 | RAN | 7264 | 0.422 | 0.3870 | No | ||
| 21 | LCK | 8104 | 0.275 | 0.3466 | No | ||
| 22 | SRC | 8170 | 0.263 | 0.3477 | No | ||
| 23 | RELA | 8283 | 0.243 | 0.3459 | No | ||
| 24 | PIK3CA | 9521 | 0.028 | 0.2798 | No | ||
| 25 | XPO1 | 10638 | -0.182 | 0.2229 | No | ||
| 26 | REL | 11228 | -0.293 | 0.1963 | No | ||
| 27 | ARRB2 | 11822 | -0.410 | 0.1715 | No | ||
| 28 | NFKB1 | 12261 | -0.493 | 0.1565 | No | ||
| 29 | BIRC2 | 13255 | -0.693 | 0.1151 | No | ||
| 30 | CHUK | 15599 | -1.323 | 0.0120 | No | ||
| 31 | TNF | 16052 | -1.492 | 0.0136 | No | ||
| 32 | SYK | 16260 | -1.568 | 0.0298 | No | ||
| 33 | MAP3K14 | 16484 | -1.670 | 0.0468 | No | ||
| 34 | PRKCA | 16510 | -1.682 | 0.0747 | No | ||
| 35 | IKBKB | 17316 | -2.217 | 0.0700 | No |